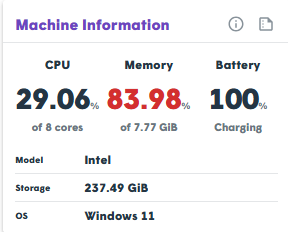
The Machine Widget provides real-time visibility into the device's hardware health and software environment, powered by the testRTC Companion Chrome Extension.
This widget is essential for identifying hardware bottlenecks that could impact telehealth session quality, such as high CPU load or low system memory.
Data Collected and Monitored
| Component | Details Shared |
|---|---|
| CPU | The current percentage of processor utilization. Values consistently above 80% may cause video lag. |
| Memory | Total system RAM vs. the amount currently in use by active processes and the browser. |
| Battery | Available percentage and estimated runtime remaining when disconnected from AC power. |
| Model & OS | Identifies the processing chip model and the version of the operating system (e.g., Windows 11, macOS). |
| Storage | The total storage capacity across all connected drives. |
Critical Indicators
⚠️ Attention Required:
Any metric highlighted in red indicates a critical issue that needs immediate attention (e.g., CPU overheating/overloading or critically low battery).